Ask four different data sources what home prices did in Forest Hills over the past year and you will get four different answers, and none of them are lying to you.
One widely cited neighborhood report, built on StreetEasy market data through March 2026, puts the median sale price at $615,000, up 57.9 percent year over year. Zillow's own home-value estimate for the neighborhood, as of mid-2026, shows the typical home worth $607,250, down 6.8 percent over the same twelve months. Movoto's July 2026 listing data shows the median asking price falling to $389,000, down 13 percent from a year earlier. PropertyShark's June 2026 report shows the overall median sale price down 2.9 percent year over year, in the same report where it shows every individual housing type selling for more than it did a year earlier. Four real numbers, four real time windows, one neighborhood, and four stories that contradict each other on their face.
If you are comparing Forest Hills to another Queens neighborhood right now, this matters more than it looks like it should. The headline median is the number every portal leads with, and in most neighborhoods it is a reasonable shorthand for what's happening to values. In Forest Hills, because of how the housing stock is built and how few homes actually trade hands in a given month, that single number can swing wildly without a single home changing in value. Understanding why is the difference between reading a market and reading noise.
The Numbers, Side by Side
Here is what four separate, dated snapshots actually showed for the same neighborhood.
| Source | Metric | Figure | Window |
|---|---|---|---|
| PropertyShark | Overall median sale price, all housing types | $417K, down 2.9% YoY | June 2026 |
| PropertyShark | Median single-family house sale | $2.2M, up 58.7% YoY | June 2026 |
| PropertyShark | Median condo sale | $1.1M, up 123.7% YoY | June 2026 |
| PropertyShark | Median co-op sale | $347K, up 1.3% YoY | June 2026 |
| Neighborhood report, StreetEasy-sourced | Median sale price, all housing types | $615K, up 57.9% YoY | Through March 2026 |
| Zillow | Typical home value | $607,250, down 6.8% YoY | As of mid-2026 |
| Movoto | Median asking price | $389K, down 13% YoY | July 2026 |
Look closely at the first four rows. They all come from the same source, in the same month. PropertyShark's own blended figure for June 2026 shows the overall median sale price down 2.9 percent year over year, at the same time its own breakdown shows houses up 58.7 percent, condos up 123.7 percent, and co-ops up 1.3 percent. Every product category moved higher, and the blended number for the month still fell. That is not a contradiction in the data. It is the mix of what happened to close that month working against the segment totals, which is exactly the trap a blended median sets for anyone comparing neighborhoods on a single number.
What's Actually Happening: A Three-Product Market With a Thin Trading Floor
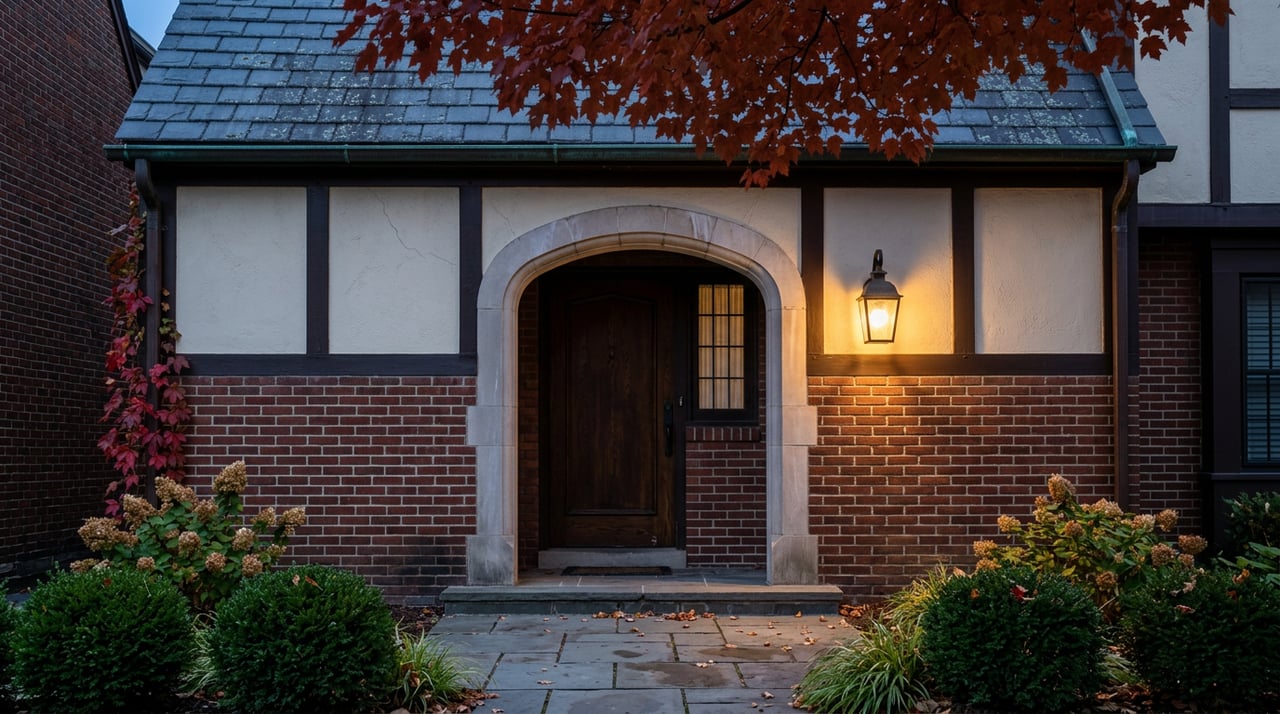
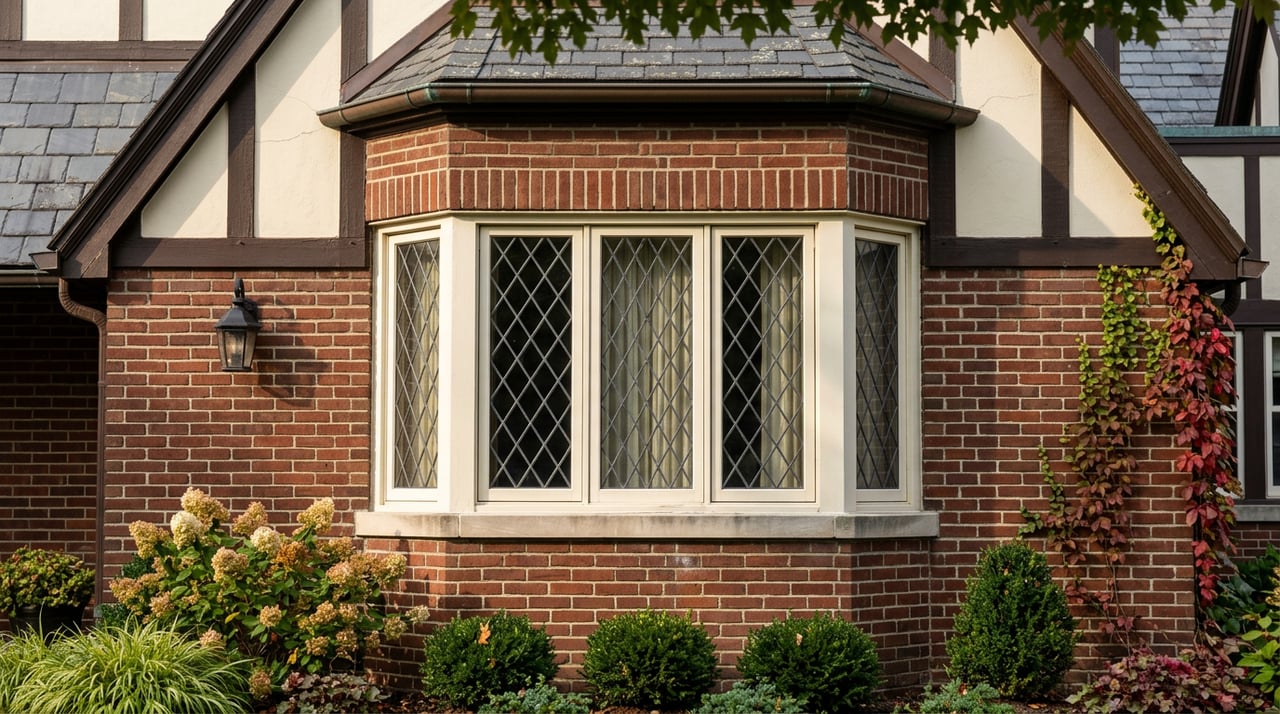
Forest Hills isn't one housing market wearing one price tag. It's three markets stacked under one neighborhood name: co-ops that make up the bulk of what actually sells, condos that trade at a meaningful premium, and detached houses, many of them inside the private, Tudor-style enclave of Forest Hills Gardens, that occupy their own tier entirely.
Now add the volume problem. PropertyShark counted 38 total transactions in Forest Hills in June 2026, down 28.3 percent from the same month a year prior. Thirty-eight sales, split across three product types with wildly different price points, is not enough volume to produce a stable median. When only a handful of houses and condos close in any given month, one or two high-end deals can drag that segment's year-over-year percentage into triple digits, while a slightly heavier share of lower-priced co-op closings in the same month can pull the blended overall median in the opposite direction. That is how a market can show every category rising and the average falling in the same 38 sales.
That's the mechanism behind the condo number specifically. A small number of luxury condo sales in the $2 million to $3 million range are enough to pull the segment's median sharply upward in a low-volume month, and buyers evaluating the Forest Hills condo market have pointed to the Austin Condominium as the kind of building driving that top end. One or two closings there in a thin month can single-handedly make the entire condo segment look like it appreciated over 100 percent, when what actually happened is that the mix of what sold changed, not the value of any individual unit.
The One Number That's Actually Boring, and Why That's the Real Story
Look back at the table and find the number that didn't move: co-op sales, up 1.3 percent year over year to $347,000 in June 2026.
Co-ops are the dominant housing type in Forest Hills, so this is the segment with the most transaction volume backing it up, and it's the one figure in the entire dataset that behaves the way you'd expect a mature, well-established housing market to behave. It didn't spike. It didn't crater. It inched forward.
That stability shows up again in how co-ops in Forest Hills Gardens specifically have been described in local market coverage: holding and increasing in value despite having, in the words of one report, a general lack of amenities beyond location and greenspace. In other words, the value isn't coming from doormen or gyms or renovated lobbies. It's coming from the fact that these buildings sit inside one of the neighborhood's most recognizable planned communities, and buyers keep paying for that address regardless of what else the building offers.
Zoom out to the borough level and the pattern holds. A Queens-wide market analysis covering the first quarter of 2026 put typical studio and one-bedroom co-op appreciation at a modest 2 to 3 percent year over year, with well-maintained two-bedroom units in buildings carrying reasonable monthly maintenance performing closer to 4 to 5 percent. That range, not 58 percent and not negative 7 percent, is what the actual majority of Forest Hills housing stock has been doing.
If you own a co-op here, or you're comparing Forest Hills to another neighborhood specifically because you're co-op shopping, the honest answer is that you're looking at low single-digit appreciation in a stable, well-traded segment. That's a less exciting headline than the one on the portal, but it's the one your own transaction will actually resemble.
What This Means If You're Comparing Neighborhoods Right Now
Days on market tells the same fractured story as price. The blended neighborhood figure showed listings clearing in a median of 69.5 days as of the most recent report, about 10 days slower than the same point the year before. But a local market breakdown covering the first quarter of 2026 found the house segment moving in roughly 79 days on average, while co-ops and condos combined took a median of 222 days to clear. A single blended days-on-market figure hides a gap of nearly six months between how quickly a house sells and how quickly an apartment does.
That gap matters for how you plan. A seller listing a Tudor house near Cord Meyer Development or inside Forest Hills Gardens is working with a much faster expected timeline than someone listing a co-op near Austin Street, even though both properties carry the same neighborhood name and the same blended market statistics.
The practical takeaway, if you're actively comparing Forest Hills against another Queens neighborhood, is to stop evaluating the headline median entirely. Ask for the number broken out by product type: what did co-ops specifically do, what did houses specifically do, and how many transactions is that percentage actually built on. A year-over-year figure resting on a dozen sales tells you almost nothing about what your specific co-op, condo, or house is likely to do. A figure resting on three dozen co-op closings tells you a great deal.
A Few Questions Worth Asking Directly
Is Forest Hills a buyer's market or a seller's market right now? It depends entirely on which segment you mean. Co-ops, the largest and most liquid segment, are moving at a slow but steady single-digit pace with ample inventory. Houses are trading in a genuine undersupply, with faster timelines and firmer pricing. Condos are the most volatile of the three, with pricing heavily influenced by a small number of high-end closings in any given month.
Which number should I actually trust when I'm evaluating a specific listing? Recent closed comps in the same building or the same immediate block, in the same product type, matter more than any neighborhood-wide statistic. A co-op's fair value has almost nothing to do with what condos did that quarter, and vice versa.
Why did June 2026 show only 38 total sales? Low monthly transaction counts aren't unusual for Forest Hills given how the housing stock splits across three distinct product types. It's one of the reasons single-month year-over-year percentages here should be read with real caution, especially for the smaller condo and house segments.
If you're trying to figure out what a specific co-op, condo, or house in Forest Hills is actually worth right now, rather than what a blended headline number suggests, that's a conversation worth having with someone who tracks this market building by building. Rachel Borut has spent a career in this neighborhood watching these numbers move for reasons the portals don't explain. Schedule a consultation and get a read on your specific property, not the average of three very different markets wearing one name.